The
Heimdallr
Daily Report
Hemdallr Daily Report (HDR) reaches your mailbox with valuable charts every working day.
You will receive remarkable insights about levels, breakouts and more to be ready for your trading day.
Traders who receive the report consistently treat trading as a business. While there is no guarantee that you will make money, having a plan is crucial if you want to be consistently successful and survive in the trading game.
Before the market opens, do you check what is going on around the world? HDR is a good way of gauging the mood before the market opens thanks to the massive information computed in the night.
What you get daily on HDR:

All thirty tickers are coming with a price chart and technical indicators. Every day a new chart display valuable information with a different timeframe.
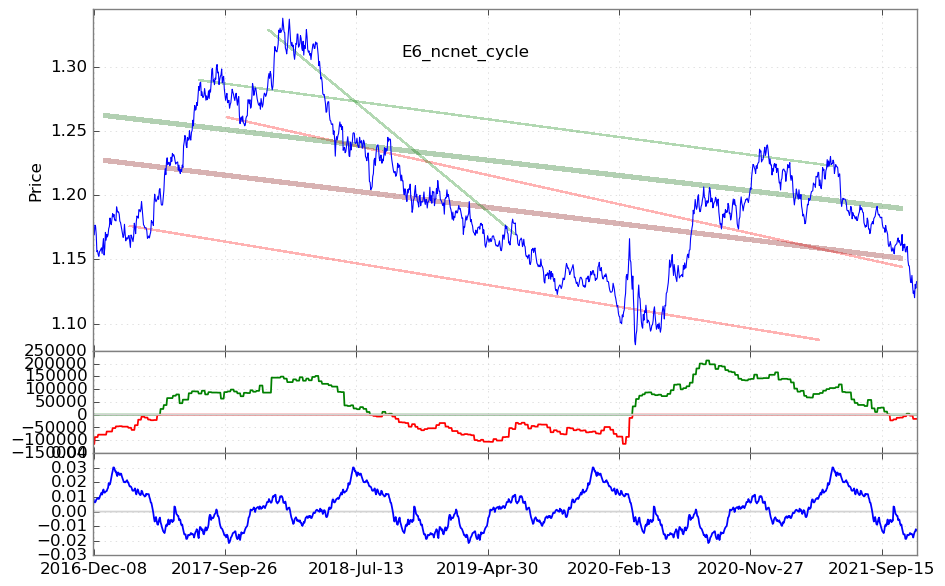
The above chart is the Euro Fx price plot together with AI trend lines, cot non-commercial net and cycle.
Support & Resistance
Our Machine learning delivers the nearest levels computed daily.
Trend-lines
Charts show the automatic trend lines produced by our AI.
Candlestick Patterns
For pattern followers, get statistics over the last pattern event that occurred.
Seasonality
You get a notice if today a strong seasonality is expected.
Pullback
Our indicator indicates if the price is on a pullback or rebound area over the main trend.
Cot Analysis
What institutional speculators are doing? Get information on market scenarios and market sentiment over the ticker.
News Sentiment
Actual news sentiment is provided by our premium NPL engine.
ML Forecast
Our machine learning forecast for the day.
Break Out
Show if a breakout happened on the daily bar.

Get a sample
Download a copy of the report as a PDF file.
Pros trade based on probabilities and objective information. They don’t gamble. The HDR provides you an advantage for valuable information and allows you to be consistent in your trading business.
Breakout signal analysis

Besides one study over our Breakout locator engine. In this case, we consider bearish breakouts only.
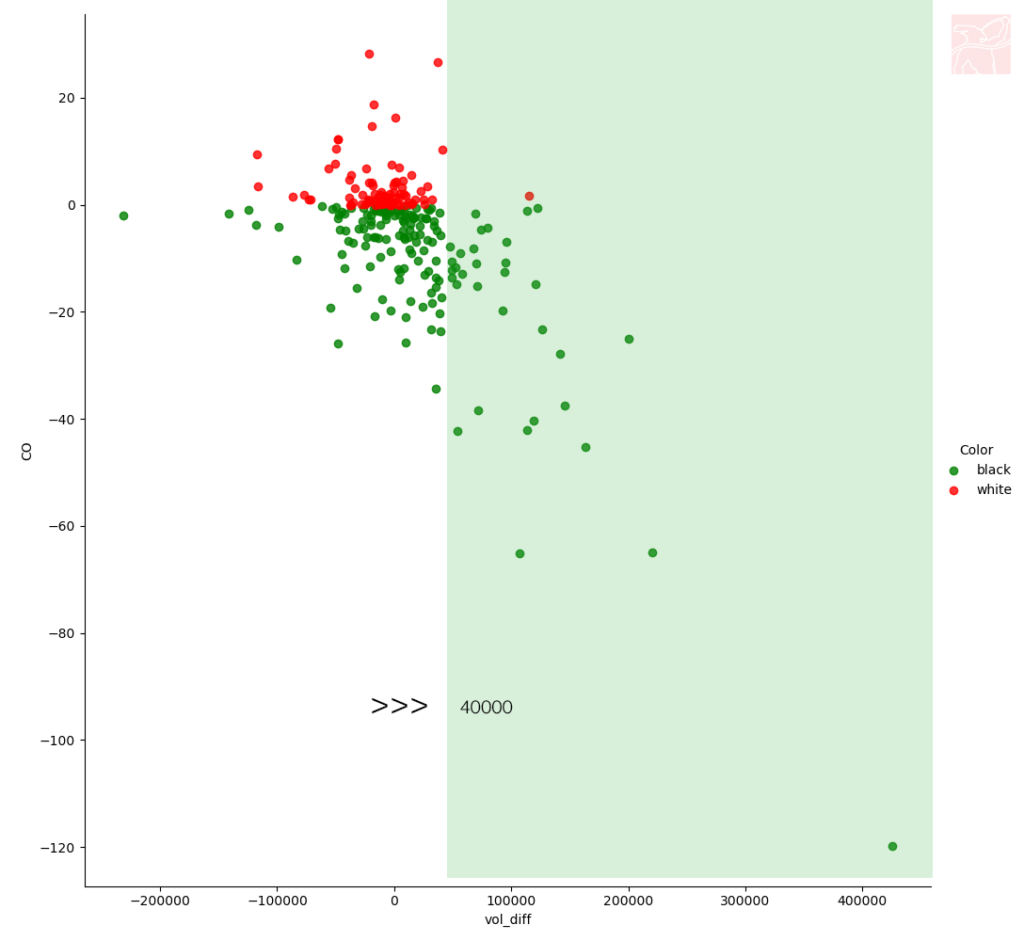
The Ticker is GC (Gold), data tracked over 20 years daily continuous futures. Each point you see in the chart is a breakout down.
On the X (vol_diff) we have the volume difference from the 7 periods volume average of the day when the breakout occurred.
On the Y (CO) we have the Close – Open value of NEXT candle from the Bearish Breakout.
For example, a breakout down occurred on 21 January 2016 then we track the volume on that day and the price excursion of the next day 22 January 2016.
As you can see when the breakout has a vol_diff > 40000, then on the next day we have bearish closing.
Moreover, there is a direct correlation between the vol_diff and the number of points gained by the short position.

Get the Heimdallr Daily Report.
Every working day, receive the “Heimdallr Daily Report” before the market starts. Helpful information related to the trading day you are going to face.
ML forecast, candlestick pattern, breakouts and much more.
$19.90
per month
7 days trial